A Case of Incomplete SAR Reporting

In today’s regulatory landscape, financial institutions are expected to maintain airtight compliance processes, especially when it comes to critical reports like Suspicious Activity Reports (SARs) required under anti-money laundering (AML) regulations. However, as demonstrated by recent simulations, even slight lapses in data aggregation or internal communication can lead to significant regulatory consequences. In this article, we will explore an operational risk scenario where Monte Carlo simulations shed light on the potential fallout of incomplete SAR filings. We’ll look at how this advanced risk modeling technique helps institutions prepare for the unexpected and mitigate costly risks.

Understanding the Scenario: Incomplete SARs and Regulatory Fallout

Imagine a bank that operates across various divisions—retail, high-net-worth (HNW) individuals, and treasury. Each of these divisions generates transaction data that needs to be aggregated and analyzed to detect suspicious activity. But what happens when the system responsible for aggregating this data misses certain high-risk patterns?

In this scenario, faulty data aggregation and miscommunication between the IT and compliance teams led to SARs being filed with incomplete information. While the IT team had identified the issue, the problem was never escalated to the compliance team, who continued to submit these incomplete reports. A regulatory audit, such as an S166 review by the Financial Conduct Authority (FCA), later revealed this critical failure.

Key Insights from the Monte Carlo Simulation

Monte Carlo simulations are invaluable tools for understanding how these operational failures can impact an institution. The dataset modeled several parameters to predict the cost and duration of remediation, potential efficiency losses, and the likelihood of uncovering deeper systemic issues. Here are the significant takeaways:

  • Remediation Duration: The simulation showed a remediation timeline ranging from 12 to 78 weeks, with an average of 26 weeks, depending on the severity of the failure. This wide range reflects the uncertainty in resolving such complex IT and communication issues.
  • Cost Implications: Weekly consultancy and legal fees during the review were estimated between £10,000 and £50,000, with a mean of £20,000. Over the course of a potential 26-week remediation period, this could add up to nearly £500,000. The possibility of an IT overhaul—should systemic issues be discovered—could drive costs even higher, reaching a mean estimate of £1,000,000, with a 20% likelihood of overruns adding an additional 50%.
  • Operational Efficiency Loss: During the remediation process, the bank could face operational efficiency losses between 0.017% and 0.083%, small percentages that could nonetheless impact profitability over the long term. These losses stem from the diversion of resources towards resolving the regulatory breach rather than focusing on core business operations.
  • Systemic IT Issues: There’s a 30% chance that the S166 review could uncover broader systemic IT issues, requiring a significant overhaul. This introduces additional layers of risk, both in terms of operational disruptions and unexpected financial costs.

Breaking Down the Cost Drivers: Key Expressions in the Simulation

The Monte Carlo simulation provides a powerful lens through which to examine how various factors combine to determine the overall financial impact of this operational risk event. Below are the key expressions that model the event’s cost dynamics.

  1. Consultancy and Legal Fees
    Formula: Consultancy and Legal Fees weekly rate * Remediation Duration weeks
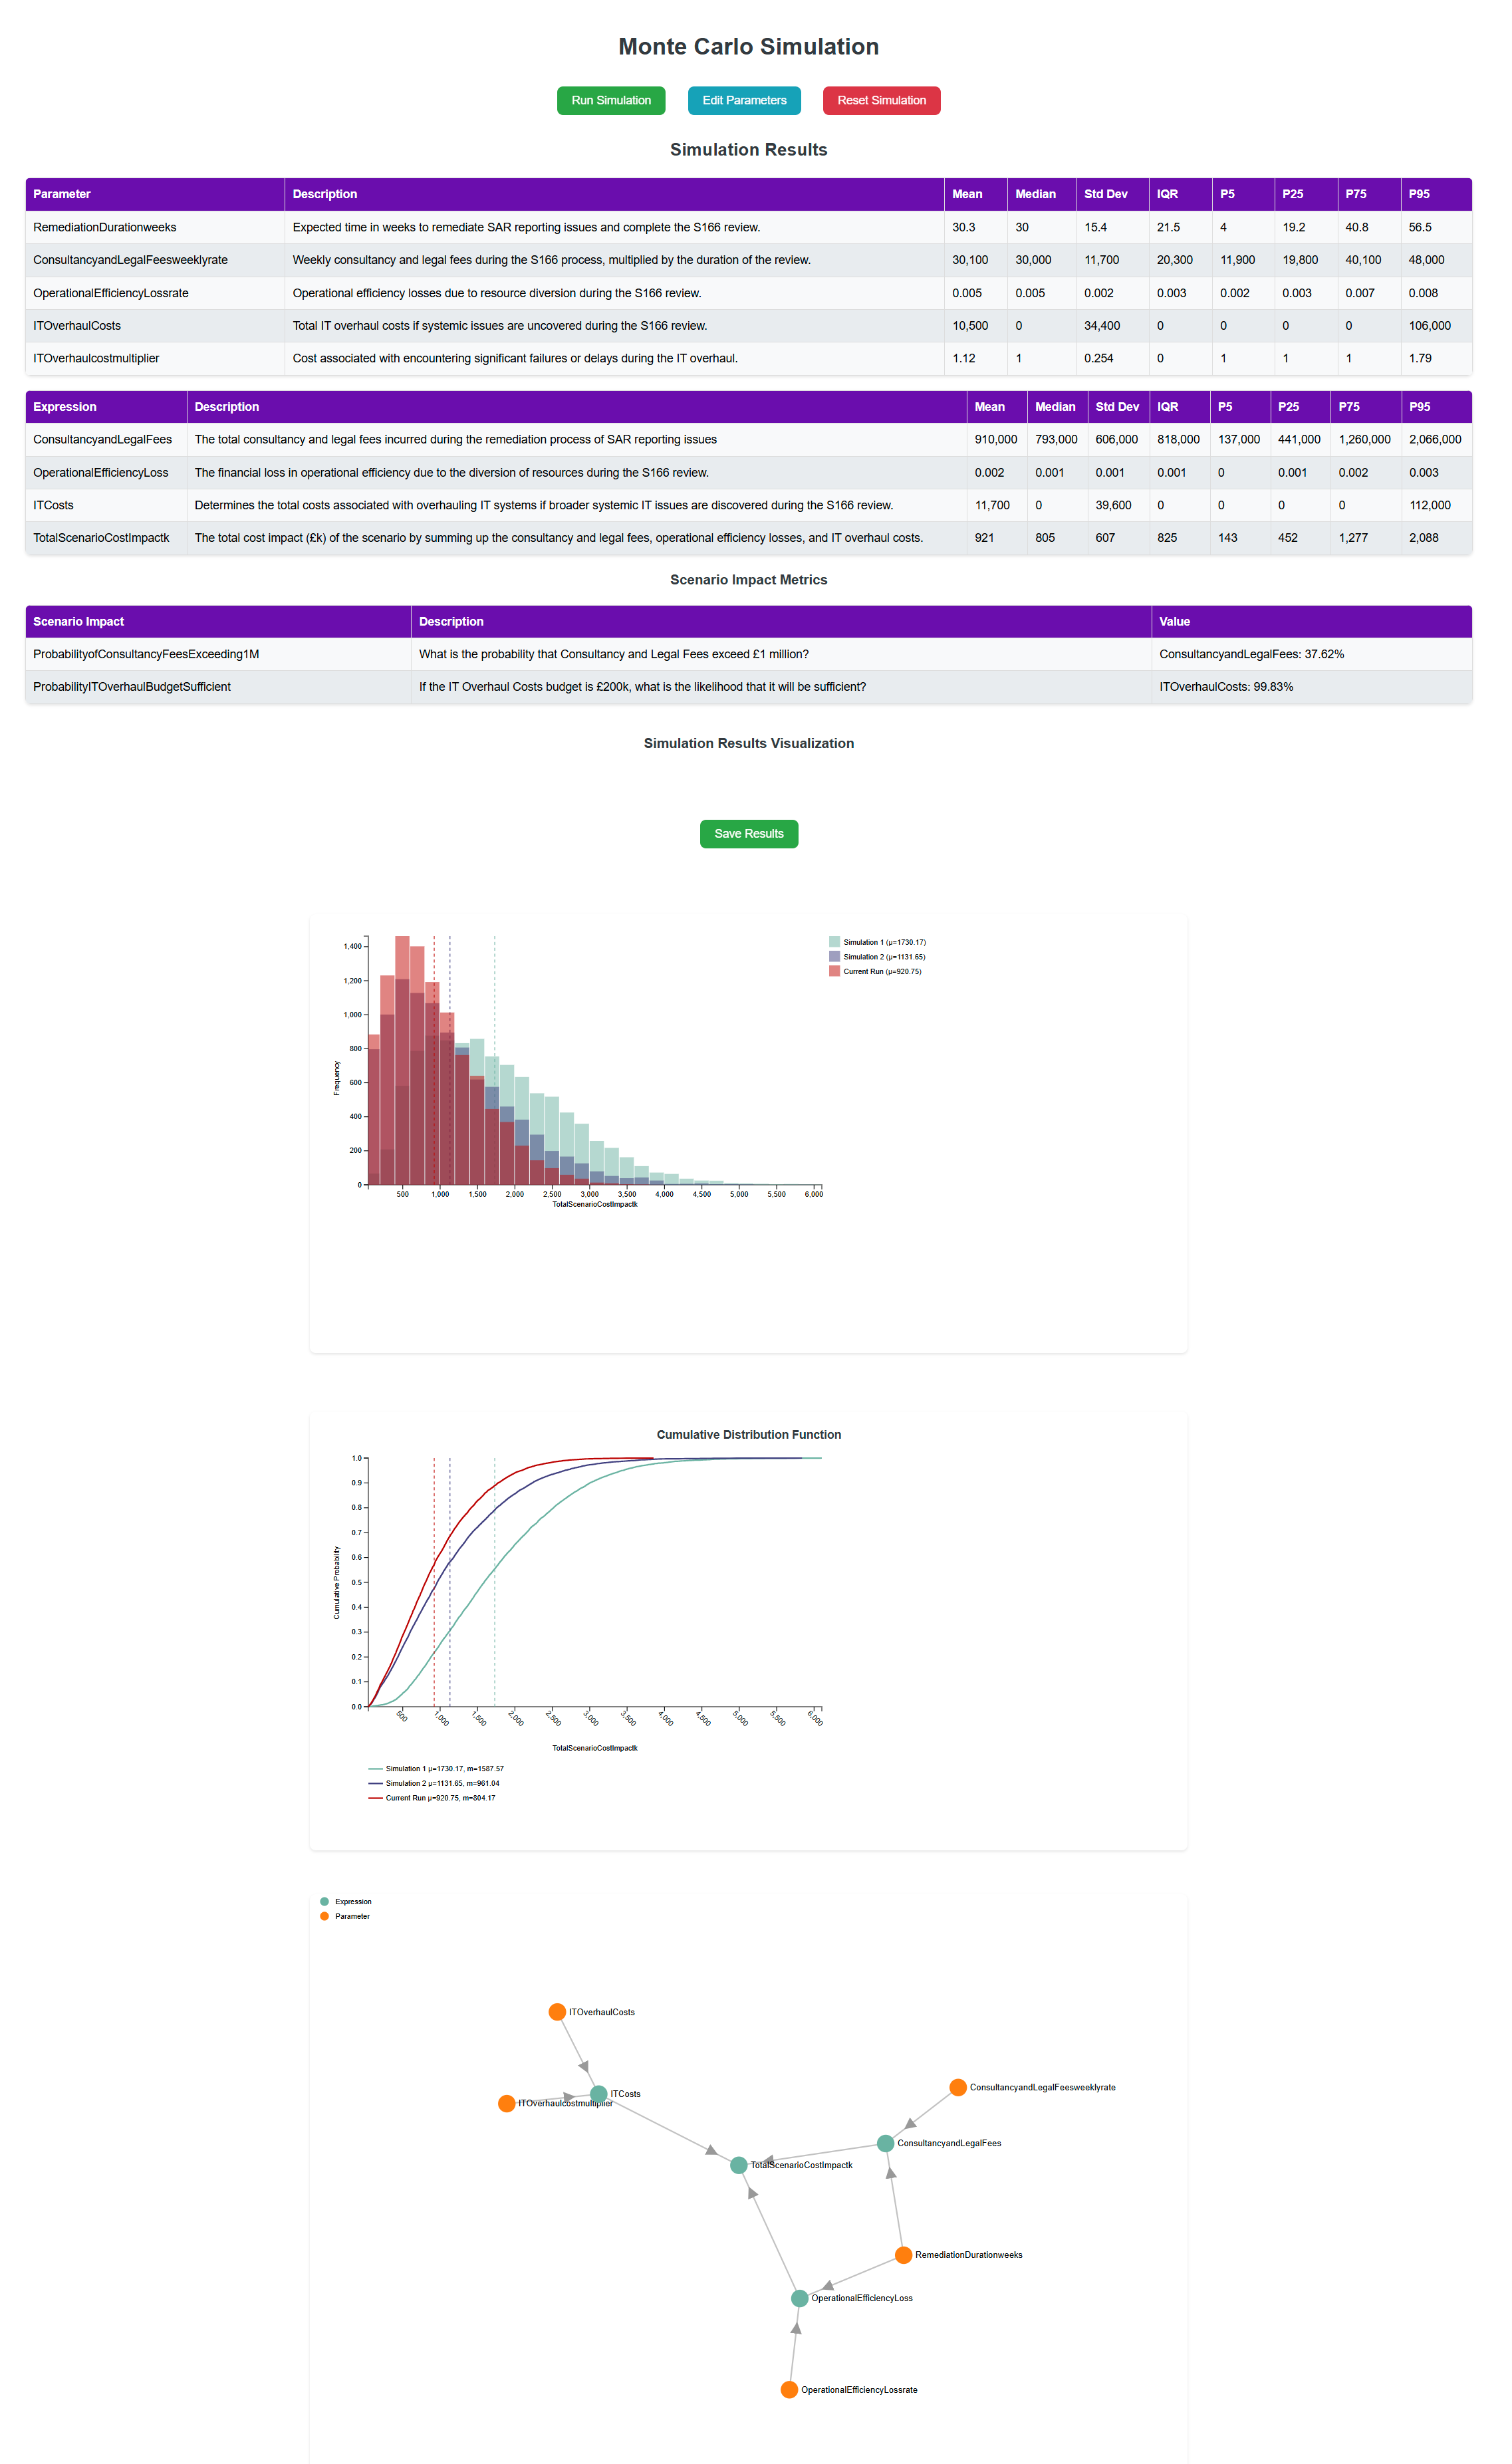
    Mean value: £1.6 million (range: up to £3.1 million)
    Key Insight: The S166 review is anticiplated to last around 51 weeks, and the weekly cost is modeled at a mean rate of £31,000. In a 1-in-20 scenario, this cost could reach £3.1 million. The length of the review significantly influences the financial impact.
  2. Operational Efficiency Loss
    Formula: (Operational Efficiency Loss rate / 100) * Company revenue * Remediation Duration weeks
    Mean value: £760,000 (range: up to £1.6 million)
    Key Insight: A minor operational efficiency loss during the review has a significant impact on the bottom line. At a rate of 0.5% (mean) of the bank’s £300 million annual revenue, this loss accumulates to around £760,000. In a 1-in-20 scenario, where losses peak at 0.8%, the total efficiency loss could rise to £1.6 million. Small inefficiencies, when compounded over time, can create significant financial stress.
  3. IT Overhaul Costs
    Formula: IT Overhaul Costs * IT Overhaul cost multiplier
    Mean value: £230,000 (range: up to £1.6 million)
    Key Insight: If systemic IT issues are uncovered during the review, the overhaul could be costly. Because of the considerable uncertainty around IT overhaul costs, we introduced the multiplier, which suggests costs could rise by nearly 80% and could exceed £1.6 million.
  4. Total Scenario Cost Impact
    Formula: Consultancy and Legal Fees + Operational Efficiency Loss + IT Overhaul Costs
    Mean value: £2.5 million (range: up to £4.8 million)
    Key Insight: Combining all the cost elements, the total scenario cost impact averages around £2.5 million. In a 1-in-20 event, this figure could rise to £4.8 million, showing the importance of preparing for low-probability but high-impact operational events.
The Power of Simulation: Small Efficiency Losses, Big Financial Impact

One of the most striking results of this simulation is how a seemingly small operational efficiency loss—modeled at a rate of 0.5%—translates into substantial financial consequences. This finding underscores the hidden costs of operational disruptions. For a company that processes millions of transactions and generates significant annual revenue, small inefficiencies compound rapidly over time, draining profits that would otherwise be reinvested into growth or innovation.

The IT Overhaul Cost Multiplier: Amplifying Financial Risk

Another key variable in the scenario is the IT overhaul cost multiplier, which introduces a layer of uncertainty around the potential expenses tied to IT failures. This multiplier reflects the likelihood that unanticipated technical difficulties or delays will drive up costs beyond initial estimates.

What’s particularly important about the multiplier is its amplifying effect on uncertainty. The base cost assumption is already significant, but the potential for it to double in the event of IT failures makes this a critical area of focus for further evaluation.

Real-World Implications for Financial Institutions

This scenario also emphasizes the importance of proactive risk management. Identifying potential system failures early, improving communication between IT and compliance teams, and investing in robust IT infrastructures are all strategies that can mitigate the risk of costly regulatory reviews and operational inefficiencies.

The findings underscore the ripple effect that overlooked errors in compliance reporting can have on a financial institution. A remediation process that takes upwards of a year, coupled with escalating consultancy fees and potential systemic IT issues, can lead to significant operational and financial strain.

More importantly, the Monte Carlo simulation helps quantify these risks, providing management with a clearer view of the potential costs and timelines involved. This empowers decision-makers to prioritize resources effectively, reduce inefficiencies, and ensure that their compliance frameworks are robust enough to avoid such regulatory pitfalls.

The Broader Context: A Growing Need for Advanced Risk Management

Monte Carlo simulations, long a staple in financial modeling for market risk, are now proving their value in operational risk as well. Beyond the financial services sector, industries such as manufacturing and logistics are also adopting these techniques to optimize their risk management strategies, demonstrating the versatility and growing relevance of simulation-based approaches.

Adopting a data-driven scenario approach can provide the foresight needed to navigate complex environments and avoid costly oversights. Whether you are in financial services or another industry, now is the time to integrate simulation-based approaches into your operational risk management strategy.

Closing Thoughts: In an era where compliance missteps can cost millions and undermine a firm’s reputation, leveraging Monte Carlo simulations can mean the difference between reactive firefighting and proactive risk mitigation. Are you ready to take your risk management to the next level?

Is the New Machine Lease Worth It?

Crunching the Numbers on Production and Savings

Before committing to any major decision, it’s smart to crunch the numbers. And that’s exactly what ACME Donuts is doing as they consider leasing a new production machine. The hope? Lower maintenance costs, labor savings, and fewer raw material expenses. But, as we know, there’s always some uncertainty in business—so they’re turning to a simulation to predict what might happen in different scenarios.

What’s at Stake?

The company is diving into the numbers to assess how much they can save with a new machine lease. They’re looking at savings across three key areas—maintenance, labor, and raw materials—but there’s quite a bit of variability in each of these categories. Let’s break it down:

Maintenance Savings:

The simulation estimates that the company will save about £15 per unit in maintenance costs​. However, these savings could vary from a low of £10 to as much as £20 per unit​. While maintenance savings seem like a safe bet, the range shows how fluctuating repair needs could influence the final amount.

Labor Savings:

This area comes with the widest swing. The company hopes for £3 in labor savings per unit​, but this is far from guaranteed. The simulation shows a possible range from £8 in savings per unit down to a loss of £2 per unit​. Yes, the new machine could potentially cost more in labor if it requires extra hands or more expensive hands to operate effectively. It’s crucial for the company to account for this potential downside in their planning.

Raw Materials Savings:

As for raw materials, the company expects to save about £6 per unit​. But, much like labor and maintenance, this isn’t set in stone. Depending on how efficiently the new machine uses materials, savings could range from £3 per unit on the low end to £9 per unit on the high end​.

Running the Numbers on Production Levels

Of course, it’s not just about saving money—it’s about producing enough units to make the lease worthwhile. The company expects to typically produce around 15,000 units, but depending on how things shake out, that number could rise to 29,000 or drop to as low as 4,800 units​.

The simulation helps them understand the variability. Even though they’re aiming for high production, the uncertainty around different factors—like demand, machine efficiency, and external influences—means they need to account for all possibilities.

The “What If?” Scenario: Losing a Contract

Now, let’s talk about one specific scenario: What if the company loses a major contract?

Losing the contract isn’t a given – it’s only a 10% chance—but they want to see how losing an order for 5,000 units would affect their numbers​. The impact also depends on when that loss happens; if it occurs early in the year, they’d feel the sting more, but even so, the analysis shows they could still produce around 20,000 units​. So, while a contract loss would be inconvenient, it’s wouldn’t be a calamity.

The value of this scenario isn’t that the company expects it to happen—it’s that the simulation shows how they could prepare if it did. Planning for the unexpected, even unlikely events, helps build resilience into their business.

Will They Hit Their Savings Target?

So, what do the numbers say?

If the same scenario were played out thousands of times—as is done in a Monte Carlo simulation—the expected savings for the company would be around £583,000. This represents the average outcome. However, there’s a 1-in-20 chance (95th percentile) that savings could exceed £868,000, and on the other hand, there’s an equal 1-in-20 chance (5th percentile) that savings could fall below £321,000. While these outcomes represent the extremes, they help the company see the full range of possible outcomes before making a final decision.

What the Company Can Learn from This

This simulation provides invaluable insights into how different factors—both expected and unexpected—can impact their bottom line. By running scenarios, they can see where their biggest risks lie, whether it’s lower-than-expected savings on labor, variability in production levels, or the unforecast loss of a contract.

More than anything, Monte Carlo simulation gives them confidence—they know what to expect in most situations, and they’re prepared for the outliers. Whether they move forward with the lease or adjust their plans, they’ll be making a well-informed decision backed by appropriate analysis.

Mr. Whimsy’s Summer of Surprises

Mr. Whimsy’s Summer of Surprises: Navigating Ice Cream Sales, Sun, and Setbacks

Ah, the sweet sound of an ice cream van jingling down the street! Picture this: Mr. Whimsy, our friendly neighbourhood ice cream van man, is preparing for another summer, ready to scoop joy into every cone. With 100 days of sunshine ahead (or so he hopes), and aiming to sell 100 ice creams a day at £3 a pop, Mr. Whimsy does the math—£30,000 in revenue sounds like the perfect summer payday.

But as we all know, running a business—especially one as weather-dependent as ice cream—comes with its fair share of twists and turns. Freak storms, equipment breakdowns, and the whims of customer demand are all lurking, threatening to melt away those profits.

Thankfully, Mr. Whimsy doesn’t just rely on good vibes and a sunny disposition. He’s armed with something even better: a plan. Using some clever number crunching (don’t worry, we’ll keep it simple!), he’s run a simulation to figure out just what this summer might throw his way—be it sizzling sales or slippery setbacks. So, let’s dive into what Mr. Whimsy’s crystal ball (aka a Monte Carlo simulation) tells us about his summer ahead!

Sunny Days or Stormy Skies? The Battle for 100 Days of Sales

Mr. Whimsy starts with a solid 100 days of potential sales. But, alas, not all of these will be sunny. There’s a sneaky factor called Days Lost, which includes everything from freak thunderstorms to his beloved van breaking down.

Here’s how the numbers shake out:

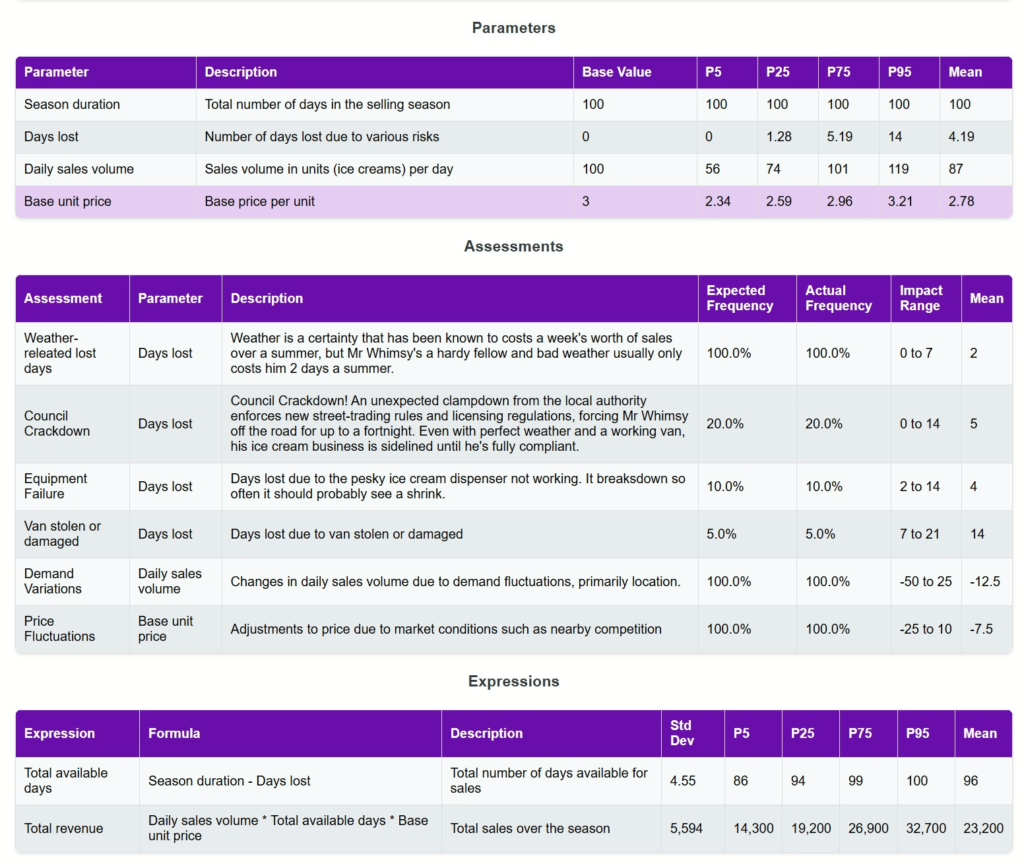
On average, Mr. Whimsy loses about 6 days over the summer. Not bad, right? But in those rare, unlucky summers, he could lose as many as 30 days—that’s nearly a third of his season gone!

Why might he lose these days? Well, the risks are real, and they’re not just about the weather. Here’s what’s causing the trouble:

Weather Woes: In the ice-cream business, weather is a given. Come rain or shine, you’ve got to roll with it. In the past, bad weather has cost Mr. Whimsy up to 7 days of sales over the course of a summer, but he’s a hardy fellow so usually he only misses 2 days when the rain gets really bad.

Equipment Failures: What’s worse than a rainy day? The day the freezer gives up the ghost! Mr. Whimsy knows equipment doesn’t last forever but a frozen freezer or defective dispenser could steal away up to 14 days of business if it packs in mid-summer.

Van Mishaps: Sometimes, the biggest threat isn’t even the weather—it’s the van. Whether it’s stolen or damaged (and yes, ice cream vans are hot property!), Mr. Whimsy could lose up to 21 days waiting for repairs or a replacement.

Wimbledon Washout! Weather woes are one thing, weather-related wildcards from climate change are another. Mr. Whimsy predicts that every five years or so, the end of summer could be hit with storm-force winds and rain lasting over a week! During such times, he’ll be stuck at home, and that could wipe out 14 days of sales in one go.

Now, not all of these events are going to happen together and this is where Mr. Whimsy turns to the power of scenario analysis. By running his trusty simulations, he can see how the various probabilities combine and he can be pretty confident that even in the most challenging of seasons, he would only lose around 14 days.

Scoops, Sales, and Sweet Success (Maybe?)

When Mr. Whimsy does get to sell, sales days can be a rollercoaster ride! Mr. Whimsy doesn’t always get prime real estate. Each week he’s assigned a location. It could be a bustling tourist trap or a dead-end tourist not-spot. If it’s the latter, with minimal foot traffic, he might struggle to sell even half of what he expected. The simulation predicts that while on the busiest days he could scoop out up to 120 cones​, on average he’ll serve around 88 ice creams per day. That’s down on his initial estimate but still a lot of smiles in a cone.

There’s also the issue of competition that will impact his prices. If he’s the only vendor in the area, he might be able to set his prices higher and still sell plenty of ice cream. But if there are more vendors nearby, he might lower his prices to stay competitive, which could cut into his revenues. Still, most days Mr. Whimsy should see steady sales, and when you multiply that by his expected average price of £2.78 per cone, things look pretty tasty.

The Grand Total: What’s in Store for Mr. Whimsy?

So, what does all this mean for Mr. Whimsy’s bank balance at the end of the summer? Across all these ups and downs, he can expect his total sales to be around £23,200, down on his intial estimate but there is the possibility (albeit likely only once-a-decade) of hitting £32,700 or more​. Now that would be a pretty sweet summer!

But let’s not sugarcoat it—if things go awry, Mr. Whimsy could be facing a tough season, with sales dropping as low as £14,300 in a severe but plausible scenario. The van’s been stolen, the rain won’t quit, and the freezer’s on strike—no ice cream empire was built without some sour days!

What’s the Lesson for All of Us?

Running a business, whether it’s ice cream or the latest whizz-bang fintech unicorn, means preparing for the unexpected. Mr. Whimsy knows that not every summer will be sunshine and high sales, but thanks to scenario analysis, he’s prepared. And that’s the real takeaway here: by planning for all the “what ifs” using smart tools like simulations, businesses can make sure they’re ready for whatever comes their way. So to prempt those occassional bad times, Mr Whimsy could build up his financial reserves, and he could look at additional insurance cover for the van and equipment. Or he could go further by changing strategy, perhaps by ditching his location agent and bagging himself a fabulous summer of festival fun instead, with bumper profits to boot! And since he knows how to run scenario analysis, he can update and re-run his model to see how these adjustments could impact his expected revenues.

The impact of price and season duration changes on expected total sales

CDF plot

What Does This Mean in Practice?

Mr. Whimsy’s ability to plan ahead gives him a clear advantage—he knows when to play it safe and when to push forward. Here’s how you can apply the same thinking:

Investing in New Equipment: Whether you’re thinking of upgrading your machinery, tech systems, or expanding your workforce, simulations can help you understand whether expected revenue can support the costs. What if revenues fall by 10% due to unforeseen market shifts? Do you still break even, or would that leave you in the red?

Launching a New Product: Thinking about rolling out a new product or service? Monte Carlo simulations can help you anticipate the best- and worst-case scenarios. If demand isn’t as high as you hoped, would you still see a return on your investment, or would that new venture become a drain on resources?

Handling Unexpected Downtime: Just like Mr. Whimsy’s equipment failures, your business might face unexpected breakdowns or system outages. Simulations can help you quantify how much downtime you can handle before it seriously impacts your operations. Do you have contingency plans in place to minimize disruptions, or would an unexpected failure catch you off guard?

Cybersecurity Threats: In today’s world, a data breach or cyberattack could grind your operations to a halt. Simulations can assess the potential impact of a cyber event—how long would it take to recover, how much would it cost, and what customer trust would you lose? Are your current defenses strong enough, or is your business more vulnerable than you think?

In all these scenarios, having a clear view of the possible outcomes—both good and bad—helps you make smarter, more informed decisions. Just like Mr. Whimsy, you’ll be ready to weather the storms, dodge the breakdowns, and come out stronger, no matter what.

So, whether you’re selling ice cream, launching a tech startup or working at a bank, get to know your risks and plan for them. Because – to paraphrase Don Kardong – in business, as in life, without ice cream or risk insights, there would be darkness and chaos.

Open to Work!
Curious about how scenario analysis can help your business? Share your email and let's have a chat.