When Client Money Goes Astray

Unpacking the True Costs of Operational Risks

Over the weekend, TrustePensions implemented a routine update to their in-house pension management system, “PensionFlow.” On Monday morning, operations at their Birmingham headquarters resumed as usual, with client transactions processing through the system, allocating funds to various pension accounts. However, an untested piece of code was included in that update—a small oversight in the release process that would soon cause a significant issue.

Among the thousands of accounts managed by TrustePensions, approximately 100 were engaged in high-value transactions, including large pension withdrawals, annuity purchases, and mid-cycle contributions. These transactions require manual processing and additional layers of validation to ensure accuracy and compliance. The untested code inadvertently misallocated client funds across these 100 accounts.

By midday, a few clients had noticed discrepancies in their account balances. Initially, these anomalies were assumed to be routine market fluctuations, and customer service handled them accordingly. However, as the afternoon progressed and the end-of-day reconciliation began, the reconciliation team, led by Daniel Lewis, began noting the discrepancies. A detailed investigation revealed the misallocation caused by the weekend release, necessitating immediate action.

The response was swift: Simon Turner, the Chief Technology Officer, halted all new transactions and rolled back the update. Reprocessing the day’s transactions, verifying data accuracy, and restoring correct balances was a labor-intensive effort, extending well beyond normal operating hours. TrustePensions would have to suspend pension contributions and adjustments for the affected clients—potentially adding to the complexity of each reconciliation.

Compounding the challenge, there was a 20% chance that an additional cohort of clients—estimated between 50 to 100 accounts—might also require reconciliation, potentially increasing the workload. These accounts involved complex transactions that couldn’t be swiftly automated, necessitating manual intervention and increasing the risk of further errors.

Reconciliation: The Real Picture

For TrustePensions, a firm with a zero-tolerance policy on client money misallocations, the real challenge is not just how long reconciliation will take—but how quickly the issue can be resolved. The firm needs to know it is operationally resilient because, according to the Monte Carlo simulation, the total effort required to resolve the misallocation averages 15.6 days of work if handled by a single person.

The practical implication is that 16 staff members would need to be fully dedicated for an entire day to bring client accounts back in line. This raises critical questions: Does TrustePensions have the capacity to handle this in-house, or will they need to outsource the reconciliation effort? Internal teams may be stretched thin or lack the expertise needed to handle such a large, rapid reconciliation task.

This underscores the importance of resilience in effective risk management—not just estimating how long it may take to recover, but ensuring the right people, with the right skills, are available when needed.

Operational Resilience: A Board-Level Issue

In this scenario, the real challenge lies in resolving the issue within the firm’s zero-tolerance policy on client money misallocations. TrustePensions must immediately determine whether it has the internal capacity to redeploy staff or if external consultants need to be brought in—skilled, fast, and available on the same day—to ensure the issue is fully reconciled as soon as possible. Missing this deadline wouldn’t just breach internal thresholds—it would likely set off alarm bells with the FCA.

This is where the Key Risk Indicators (KRIs), tested through the scenario simulation, come into play. The KRI threshold isn’t just a nice-to-have—it’s an early-warning trigger. It tests whether the firm can mobilise sufficient, qualified resources to compress what would normally be a multi-week reconciliation process into a single day. This is not business as usual, and the Board must ensure that these KRIs serve as real action points—not hypothetical markers.

KRIs should prompt an immediate response whether triggered by live events or through plausible scenario simulations. The Board must shift its focus to ensuring that the firm’s operational resilience can meet the demands of these KRIs. The goal is simple: avoid breaching the trust of both clients and regulators by ensuring the firm is always ready to respond swiftly and effectively.

Financial Impact: Beyond Initial Estimates

The incident was projected to cost £15,600, based on the updated estimate of time and cost:

This projection assumes an average external resource rate of £2,000 per day, with each day covering an eight-hour shift. Reconciling 100 client accounts would take approximately 1 hour per account, or about 15.6 days in total.

However, the zero-tolerance policy makes this a far more complex operational challenge. Rather than spreading the workload across many days, the firm must concentrate the effort into a single day. Furthermore, the simulation has challenged a number of baseline assumptions, meaning the resulting analysis suggests the firm needs to effectively compress 15.6 days’ worth of work into just 24 hours.

The cost implications extend beyond just time. TrustePensions must determine whether it could pull in internal teams, which would strain other operations, or whether it could secure enough skilled external consultants to handle the volume of work. Either option will add significantly to the overall cost and bring their own risks. Based on our simulation, the financial impact is expected to be nearer £61,700, with the potential to reach £123,000 if additional cases are identified.

Beyond the ripple effect of operational risk costs due to urgency and skilled resourcing, this scenario reveals a key takeaway: what starts as an impact assessment of a client money misallocation can become a resilience testing opportunity. The significantly increased financial implications emphasise the need for TrustePensions to invest in advanced reconciliation tools, enhance staff training, and establish robust incident response protocols to effectively manage and mitigate such risks.

Potential Impact of Losing a Credit Risk Modelling Team

In banking, some risks are obvious—credit defaults, market downturns, or operational failures. Others are more subtle but equally impactful. The loss of a small, specialised team may seem manageable but, as our analysis shows, can trigger financial consequences extending beyond the immediate impact.

This article examines a scenario in which a bank loses its Credit Risk Modelling Team, leading to a gradual degradation of the accuracy of its credit models over 12 months. Using a Monte Carlo simulation, we quantify the potential financial impact of this event and explore the relationships between the various outcomes.

The Core Impact: Model Accuracy and Revenue Loss

Credit risk models are the engine behind the pricing and management of high-risk loan portfolios, such as commercial loans and subprime lending. In this simulation, a 5% reduction in model accuracy results in £125,000 in lost revenue from a £50 million portfolio over 12 months. This loss results from the bank’s struggle to price loans accurately—either being overly cautious and losing business or accepting riskier loans that may lead to future losses.

This revenue loss represents a 0.25% decline relative to the portfolio size. Although it seems small, tight margins in the competitive lending market mean even slight fluctuations can impact profitability. The bank’s lending decisions become less informed, potentially leading to a misalignment between risk and return.

The Tension Between Provisions and Revenue

One of the key insights from this scenario is the direct tension between increasing loan provisions and protecting revenue. As the model degrades, the bank’s risk assessment becomes less reliable, leading to an increase in loan loss provisions by £100,000—a 1% rise relative to the existing £10 million reserve. This adjustment is the bank’s way of cushioning itself against higher default risks due to less accurate risk predictions.

However, the need to increase provisions often competes with the drive to maintain profitability. If the bank becomes too conservative, setting aside more for potential losses, it constrains the capital available for lending, which can further depress revenue. This balancing act is one of the more nuanced aspects of managing risk in a banking environment.

Importantly, the 1% increase in provisions relative to the loan reserve is more significant than the 0.25% revenue decline, indicating the bank prioritises caution over profitability as model accuracy declines. This can protect the bank in the short term but may limit growth if revenue generation continues to slide.

Regulatory Risk: The Bigger “What If”

Perhaps the most uncertain, but potentially significant, outcome from this scenario is the risk of additional regulatory oversight. As credit models degrade, there’s a chance that regulators will scrutinise the bank’s risk management practices more closely, leading to additional costs from audits, validations, and possible corrective measures. The probability of this intervention is modeled at 10%, with an expected cost of £125,000—a sum comparable to the revenue loss.

However, this cost could rise sharply with regulatory intervention, potentially reaching £2 million in a worst-case scenario. Such intervention might lead to enforced capital charges or costly actions like external model revalidation or portfolio restructuring.

Crucially, though, the likelihood of such regulatory action is low. The simulation places a 95% threshold for total financial impact at £600,000, which is well below the £1.5 million 1-in-200 scenario loss. This suggests that while regulatory risk is a concern, it remains more of a “tail risk”—unlikely, but costly if realised.

The Real Insight: It’s About Understanding The Risk

One of the key takeaways from this scenario is that the expected financial hit from losing the Credit Risk Modelling Team—£150,000 on average—is manageable, representing only a small percentage of the overall portfolio.

The real insight lies in how moderate impacts—steady revenue decline and slight provision increases—can compound over time. Moreover, this scenario highlights how the degradation of credit risk models has a ripple effect across revenue, provisions, and compliance. These aren’t isolated costs; they interact in complex ways that require a careful balancing act. For example:

  • Increasing loan provisions reduces the risk of future losses but at the cost of immediate profitability.
  • Pursuing higher-risk loans to compensate for lost revenue may backfire, increasing defaults and regulatory scrutiny.
  • Regulatory audits, while a low probability, could compound losses, especially if remedial actions are enforced.

Conclusion: Preparing for Understated Yet Meaningful Risks

While the loss of a Credit Risk Modelling Team doesn’t immediately spell disaster for a bank, the gradual degradation in model accuracy can lead to a series of small but meaningful financial impacts. These effects accumulate over time, putting pressure on the bank’s revenue, provisions, and compliance efforts.

The key lesson for risk managers is to recognise rare outcomes like regulatory intervention, but not to overlook how incremental degradation in operational capability can progressively undermine financial performance.

This type of analysis is particularly valuable in proactive risk management. For example, it can be leveraged as part of an Operating Model review, ensuring that key functions—like credit risk modeling—are adequately staffed and supported. It could also guide succession planning, identifying critical teams that need robust contingency plans to avoid operational disruptions.

In summary, this kind of scenario-based modeling not only helps quantify the potential risks of team loss but also serves as a strategic tool for workforce and operational planning, helping firms safeguard themselves against impacts that might otherwise go unnoticed.

A Case of Incomplete SAR Reporting

In today’s regulatory landscape, financial institutions are expected to maintain airtight compliance processes, especially when it comes to critical reports like Suspicious Activity Reports (SARs) required under anti-money laundering (AML) regulations. However, as demonstrated by recent simulations, even slight lapses in data aggregation or internal communication can lead to significant regulatory consequences. In this article, we will explore an operational risk scenario where Monte Carlo simulations shed light on the potential fallout of incomplete SAR filings. We’ll look at how this advanced risk modeling technique helps institutions prepare for the unexpected and mitigate costly risks.

Understanding the Scenario: Incomplete SARs and Regulatory Fallout

Imagine a bank that operates across various divisions—retail, high-net-worth (HNW) individuals, and treasury. Each of these divisions generates transaction data that needs to be aggregated and analyzed to detect suspicious activity. But what happens when the system responsible for aggregating this data misses certain high-risk patterns?

In this scenario, faulty data aggregation and miscommunication between the IT and compliance teams led to SARs being filed with incomplete information. While the IT team had identified the issue, the problem was never escalated to the compliance team, who continued to submit these incomplete reports. A regulatory audit, such as an S166 review by the Financial Conduct Authority (FCA), later revealed this critical failure.

Key Insights from the Monte Carlo Simulation

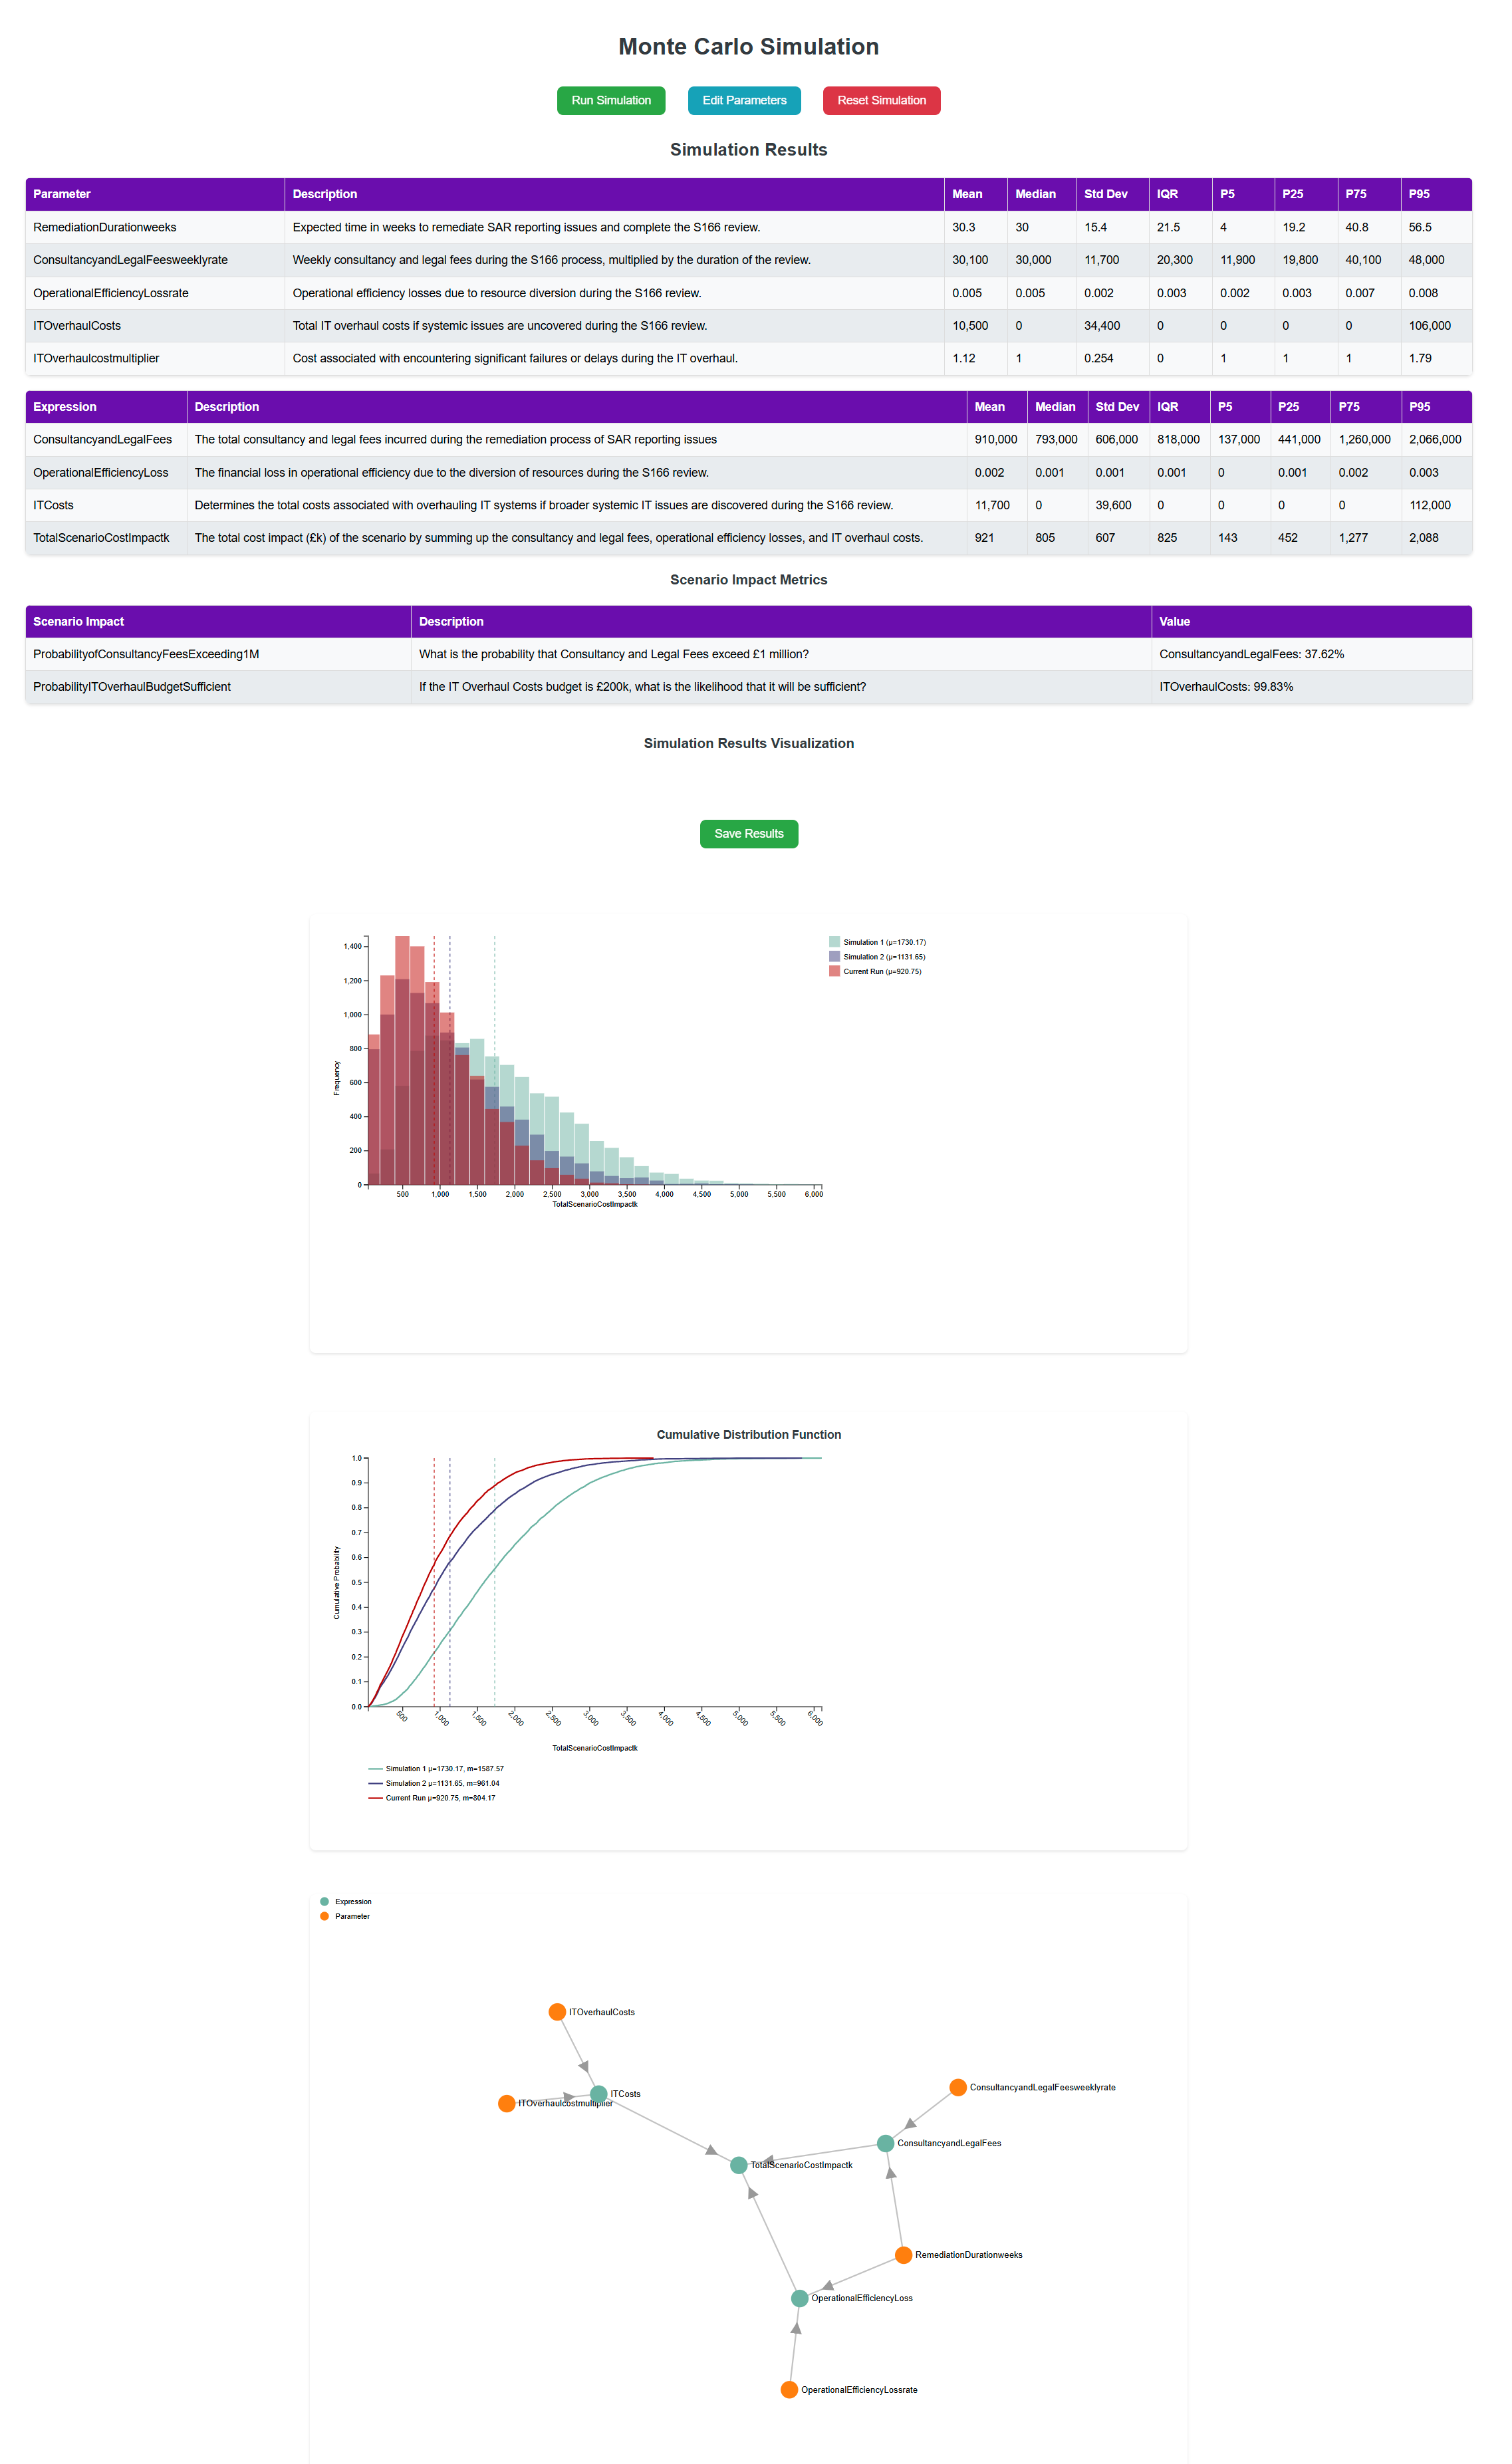
Monte Carlo simulations are invaluable tools for understanding how these operational failures can impact an institution. The dataset modeled several parameters to predict the cost and duration of remediation, potential efficiency losses, and the likelihood of uncovering deeper systemic issues. Here are the significant takeaways:

  • Remediation Duration: The simulation showed a remediation timeline ranging from 12 to 78 weeks, with an average of 26 weeks, depending on the severity of the failure. This wide range reflects the uncertainty in resolving such complex IT and communication issues.
  • Cost Implications: Weekly consultancy and legal fees during the review were estimated between £10,000 and £50,000, with a mean of £20,000. Over the course of a potential 26-week remediation period, this could add up to nearly £500,000. The possibility of an IT overhaul—should systemic issues be discovered—could drive costs even higher, reaching a mean estimate of £1,000,000, with a 20% likelihood of overruns adding an additional 50%.
  • Operational Efficiency Loss: During the remediation process, the bank could face operational efficiency losses between 0.017% and 0.083%, small percentages that could nonetheless impact profitability over the long term. These losses stem from the diversion of resources towards resolving the regulatory breach rather than focusing on core business operations.
  • Systemic IT Issues: There’s a 30% chance that the S166 review could uncover broader systemic IT issues, requiring a significant overhaul. This introduces additional layers of risk, both in terms of operational disruptions and unexpected financial costs.

Breaking Down the Cost Drivers: Key Expressions in the Simulation

The Monte Carlo simulation provides a powerful lens through which to examine how various factors combine to determine the overall financial impact of this operational risk event. Below are the key expressions that model the event’s cost dynamics.

  1. Consultancy and Legal Fees
    Formula: Consultancy and Legal Fees weekly rate * Remediation Duration weeks
    Mean value: £1.6 million (range: up to £3.1 million)
    Key Insight: The S166 review is anticiplated to last around 51 weeks, and the weekly cost is modeled at a mean rate of £31,000. In a 1-in-20 scenario, this cost could reach £3.1 million. The length of the review significantly influences the financial impact.
  2. Operational Efficiency Loss
    Formula: (Operational Efficiency Loss rate / 100) * Company revenue * Remediation Duration weeks
    Mean value: £760,000 (range: up to £1.6 million)
    Key Insight: A minor operational efficiency loss during the review has a significant impact on the bottom line. At a rate of 0.5% (mean) of the bank’s £300 million annual revenue, this loss accumulates to around £760,000. In a 1-in-20 scenario, where losses peak at 0.8%, the total efficiency loss could rise to £1.6 million. Small inefficiencies, when compounded over time, can create significant financial stress.
  3. IT Overhaul Costs
    Formula: IT Overhaul Costs * IT Overhaul cost multiplier
    Mean value: £230,000 (range: up to £1.6 million)
    Key Insight: If systemic IT issues are uncovered during the review, the overhaul could be costly. Because of the considerable uncertainty around IT overhaul costs, we introduced the multiplier, which suggests costs could rise by nearly 80% and could exceed £1.6 million.
  4. Total Scenario Cost Impact
    Formula: Consultancy and Legal Fees + Operational Efficiency Loss + IT Overhaul Costs
    Mean value: £2.5 million (range: up to £4.8 million)
    Key Insight: Combining all the cost elements, the total scenario cost impact averages around £2.5 million. In a 1-in-20 event, this figure could rise to £4.8 million, showing the importance of preparing for low-probability but high-impact operational events.

The Power of Simulation: Small Efficiency Losses, Big Financial Impact

One of the most striking results of this simulation is how a seemingly small operational efficiency loss—modeled at a rate of 0.5%—translates into substantial financial consequences. This finding underscores the hidden costs of operational disruptions. For a company that processes millions of transactions and generates significant annual revenue, small inefficiencies compound rapidly over time, draining profits that would otherwise be reinvested into growth or innovation.

The IT Overhaul Cost Multiplier: Amplifying Financial Risk

Another key variable in the scenario is the IT overhaul cost multiplier, which introduces a layer of uncertainty around the potential expenses tied to IT failures. This multiplier reflects the likelihood that unanticipated technical difficulties or delays will drive up costs beyond initial estimates.

What’s particularly important about the multiplier is its amplifying effect on uncertainty. The base cost assumption is already significant, but the potential for it to double in the event of IT failures makes this a critical area of focus for further evaluation.

Real-World Implications for Financial Institutions

This scenario also emphasizes the importance of proactive risk management. Identifying potential system failures early, improving communication between IT and compliance teams, and investing in robust IT infrastructures are all strategies that can mitigate the risk of costly regulatory reviews and operational inefficiencies.

The findings underscore the ripple effect that overlooked errors in compliance reporting can have on a financial institution. A remediation process that takes upwards of a year, coupled with escalating consultancy fees and potential systemic IT issues, can lead to significant operational and financial strain.

More importantly, the Monte Carlo simulation helps quantify these risks, providing management with a clearer view of the potential costs and timelines involved. This empowers decision-makers to prioritize resources effectively, reduce inefficiencies, and ensure that their compliance frameworks are robust enough to avoid such regulatory pitfalls.

The Broader Context: A Growing Need for Advanced Risk Management

Monte Carlo simulations, long a staple in financial modeling for market risk, are now proving their value in operational risk as well. Beyond the financial services sector, industries such as manufacturing and logistics are also adopting these techniques to optimize their risk management strategies, demonstrating the versatility and growing relevance of simulation-based approaches.

Adopting a data-driven scenario approach can provide the foresight needed to navigate complex environments and avoid costly oversights. Whether you are in financial services or another industry, now is the time to integrate simulation-based approaches into your operational risk management strategy.

Closing Thoughts: In an era where compliance missteps can cost millions and undermine a firm’s reputation, leveraging Monte Carlo simulations can mean the difference between reactive firefighting and proactive risk mitigation. Are you ready to take your risk management to the next level?

3rd party AML system outage

System Crash, Compliance Risk, and Financial Fallout

In the interconnected world of financial services, operational disruptions can quickly cascade into compliance breaches, reputational damage, and substantial financial loss. Consider a scenario where a key third-party provider responsible for anti-money laundering (AML) transaction monitoring experiences a system outage. This results in a prolonged downtime, forcing the bank to review transactions over £2,000 through a semi-automatic in-house process, while transactions exceeding £10,000 are blocked for manual review.

While manual processing may serve as a temporary workaround, it introduces significant operational strain and the risk of errors. Worse yet, failure to detect suspicious activity or failure to correctly processing transactions could potentially lead to fines or reputational harm. To quantify this risk, we ran a Monte Carlo simulation that models potential outcomes based on key parameters such as downtime duration, transaction volume, and manual error rates. The results shed light on the depth of the problem and the financial exposure that such an outage could create for the bank.


Key Findings from the Simulation: Navigating the Risks of AML Downtime

Imagine it’s midday, and your bank’s third-party anti-money laundering (AML) system suddenly crashes. At first, this seems manageable thanks to robust continuity planning. The bank has a proportional, risk-based approach: transactions below £2,000 continue to be processed normally, with a post-event review in place to identify any suspicious activity. Transactions over £2,000 are routed through a semi-automatic in-house system, while those exceeding £10,000 are sent for manual review. The response helps, but as the outage stretches into a 36-hour downtime, the backlogs grow, mistakes happen and the the pressure intensifies.

1. Downtime and Transaction Volumes: A Growing Backlog

At first, the downtime seems manageable. The average modeled downtime is 6 hours, but in more severe cases, it could last up to 18 hours or even 37 hours. As each hour passes, the number of transactions requiring AML review builds up.

Under normal conditions, the bank processes 200 transactions per hour. In a severe but plausible 36-hour outage scenario, the simulation suggests an average of 160 transactions over £2,000 will need semi-automatic processing and in an extreme event – such as an extended outage in the run up to a national holiday – this number could climb to 660 transactions. Meanwhile, while the simulation suggests on average there will be 31 high-value transactions sent for manual review, this number could rise to 140 transactions in extreme situations.

As these high-value transactions wait for manual review, customers grow impatient. Each delay compounds the risk of compensation claims and customer dissatisfaction.

2. Compensation Costs: How Delays Add Up

Every delayed transaction carries a potential compensation cost. For mid-range transactions between £2,000 and £10,000, the bank expects to pay £100 goodwill for each delayed transaction. For high-value transactions exceeding £10,000, the compensation rises to £500 per transaction.

The simulation estimates that, on average, the compensation for mid-range transactions will amount to £13,000, however this could surge to £54,000. When high-value transactions are added to the mix, compensation costs increase further. On average, these would add £16,000 to the total, but in a worst-case scenario, this could climb to £66,000. Altogether, the total compensation costs could range from £29,000 on average, up to £120,000 in a worst-case scenario. These costs, while significant, only tell part of the story.

3. Manual Errors: An Unseen Risk

As the bank turns to manual processes, another risk emerges: human error. The base assumption is that 5% of manually processed transactions will contain errors, but under pressure, this figure could rise to 7% or more.

The simulation shows that, on average, the bank could make errors in the processing of 14 transactions resulting in an additional £3,300 in additional compensation costs. However, in a worst-case scenario, with high volumes and a higher error rate, manual errors could cost the bank up to £25,000. These errors aren’t just financially costly—they further strain operational resources and damage client trust.

4. Worst-Case Scenario: When Everything Goes Wrong

As it turns out, the simulation suggests the event will be around 6 hours in duration, impacting around 160 customers, requiring £32,000 to be paid in compensation. However, the extreme 1-in-200 scenario, the downtime drags on, more transactions are delayed, manual errors spike, and compensation claims stack up. In this scenario, the bank would have to compensate 1,200 customers including additional payments for errors to 98 of those customers, with an expected compensation bill of £140,000. Even in a severe yet plausible 1-in-20 scenario, the compensation could still reach £87,000.

Beyond the financial impact, the reputational risk looms large. High-value clients might tolerate a short delay, but extended downtime—especially when coupled with errors—could lead to long-term damage to the bank’s customer relationships. And on top of all this, the response of the regulator could be significant.


Bringing It All Together: The Broader Implications of Downtime

The narrative that emerges from this simulation isn’t just about compensation—it’s about operational vulnerability and gaining insight into our risk tolerance and thresholds. A system crash may seem like a technical glitch, but as this scenario shows, the financial and reputational risks escalate rapidly. Even with semi-automatic systems and manual reviews in place, prolonged downtime amplifies costs, frustrates customers, and risks compliance breaches.

Monte Carlo simulations give us a way to anticipate these risks, providing a clear picture of how different scenarios play out. For a bank relying on third-party services for critical AML monitoring, understanding the worst-case scenarios is essential to avoid the financial and reputational fallout.

In today’s fast-moving world, data-driven risk management is no longer optional. Firms must embrace these tools to assess operational resilience and protect against the unexpected.


Strengthen Your Operational Resilience with Simulation-Based Risk Management

In light of these findings, Risk functions should take proactive steps to incorporate Monte Carlo simulations into their operational risk management frameworks. Understanding the potential range of outcomes, from best-case to worst-case scenarios, enables better decision-making and more effective resource allocation during a crisis.

If your organisation relies on third-party services for critical functions such as AML monitoring, now is the time to evaluate your disaster recovery and business continuity plans. How well-prepared are you for a similar outage? How can simulation-based tools help quantify and mitigate these risks?

By adopting simulation-based approaches, financial institutions can better manage the complexities of operational risk and ensure they are prepared for the unexpected. In today’s uncertain world, it’s not just about managing what you know—it’s about preparing for what you don’t.

The future of risk management lies in data-driven simulations. It’s time to harness their power to secure your organisation’s financial and operational future.

Is the New Machine Lease Worth It?

Crunching the Numbers on Production and Savings

Before committing to any major decision, it’s smart to crunch the numbers. And that’s exactly what ACME Donuts is doing as they consider leasing a new production machine. The hope? Lower maintenance costs, labor savings, and fewer raw material expenses. But, as we know, there’s always some uncertainty in business—so they’re turning to a simulation to predict what might happen in different scenarios.

What’s at Stake?

The company is diving into the numbers to assess how much they can save with a new machine lease. They’re looking at savings across three key areas—maintenance, labor, and raw materials—but there’s quite a bit of variability in each of these categories. Let’s break it down:

Maintenance Savings:

The simulation estimates that the company will save about £15 per unit in maintenance costs​. However, these savings could vary from a low of £10 to as much as £20 per unit​. While maintenance savings seem like a safe bet, the range shows how fluctuating repair needs could influence the final amount.

Labor Savings:

This area comes with the widest swing. The company hopes for £3 in labor savings per unit​, but this is far from guaranteed. The simulation shows a possible range from £8 in savings per unit down to a loss of £2 per unit​. Yes, the new machine could potentially cost more in labor if it requires extra hands or more expensive hands to operate effectively. It’s crucial for the company to account for this potential downside in their planning.

Raw Materials Savings:

As for raw materials, the company expects to save about £6 per unit​. But, much like labor and maintenance, this isn’t set in stone. Depending on how efficiently the new machine uses materials, savings could range from £3 per unit on the low end to £9 per unit on the high end​.

Running the Numbers on Production Levels

Of course, it’s not just about saving money—it’s about producing enough units to make the lease worthwhile. The company expects to typically produce around 15,000 units, but depending on how things shake out, that number could rise to 29,000 or drop to as low as 4,800 units​.

The simulation helps them understand the variability. Even though they’re aiming for high production, the uncertainty around different factors—like demand, machine efficiency, and external influences—means they need to account for all possibilities.

The “What If?” Scenario: Losing a Contract

Now, let’s talk about one specific scenario: What if the company loses a major contract?

Losing the contract isn’t a given – it’s only a 10% chance—but they want to see how losing an order for 5,000 units would affect their numbers​. The impact also depends on when that loss happens; if it occurs early in the year, they’d feel the sting more, but even so, the analysis shows they could still produce around 20,000 units​. So, while a contract loss would be inconvenient, it’s wouldn’t be a calamity.

The value of this scenario isn’t that the company expects it to happen—it’s that the simulation shows how they could prepare if it did. Planning for the unexpected, even unlikely events, helps build resilience into their business.

Will They Hit Their Savings Target?

So, what do the numbers say?

If the same scenario were played out thousands of times—as is done in a Monte Carlo simulation—the expected savings for the company would be around £583,000. This represents the average outcome. However, there’s a 1-in-20 chance (95th percentile) that savings could exceed £868,000, and on the other hand, there’s an equal 1-in-20 chance (5th percentile) that savings could fall below £321,000. While these outcomes represent the extremes, they help the company see the full range of possible outcomes before making a final decision.

What the Company Can Learn from This

This simulation provides invaluable insights into how different factors—both expected and unexpected—can impact their bottom line. By running scenarios, they can see where their biggest risks lie, whether it’s lower-than-expected savings on labor, variability in production levels, or the unforecast loss of a contract.

More than anything, Monte Carlo simulation gives them confidence—they know what to expect in most situations, and they’re prepared for the outliers. Whether they move forward with the lease or adjust their plans, they’ll be making a well-informed decision backed by appropriate analysis.

Mr. Whimsy’s Summer of Surprises

Mr. Whimsy’s Summer of Surprises: Navigating Ice Cream Sales, Sun, and Setbacks

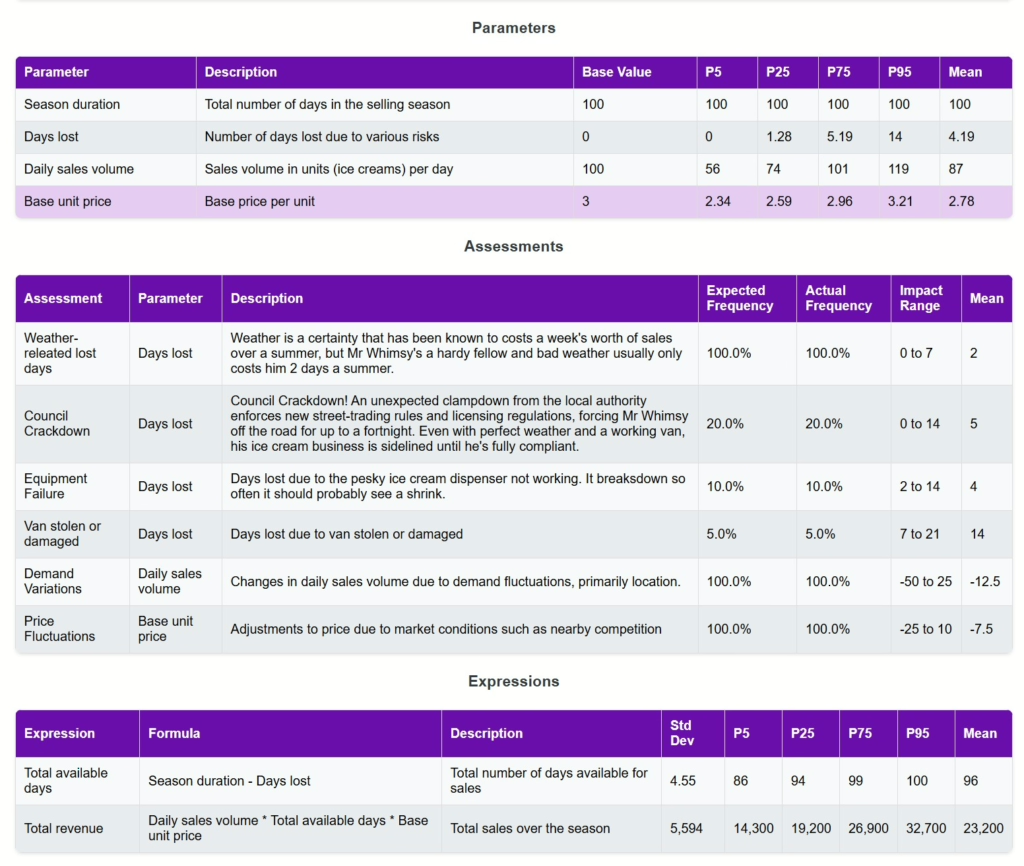
Ah, the sweet sound of an ice cream van jingling down the street! Picture this: Mr. Whimsy, our friendly neighbourhood ice cream van man, is preparing for another summer, ready to scoop joy into every cone. With 100 days of sunshine ahead (or so he hopes), and aiming to sell 100 ice creams a day at £3 a pop, Mr. Whimsy does the math—£30,000 in revenue sounds like the perfect summer payday.

But as we all know, running a business—especially one as weather-dependent as ice cream—comes with its fair share of twists and turns. Freak storms, equipment breakdowns, and the whims of customer demand are all lurking, threatening to melt away those profits.

Thankfully, Mr. Whimsy doesn’t just rely on good vibes and a sunny disposition. He’s armed with something even better: a plan. Using some clever number crunching (don’t worry, we’ll keep it simple!), he’s run a simulation to figure out just what this summer might throw his way—be it sizzling sales or slippery setbacks. So, let’s dive into what Mr. Whimsy’s crystal ball (aka a Monte Carlo simulation) tells us about his summer ahead!

Sunny Days or Stormy Skies? The Battle for 100 Days of Sales

Mr. Whimsy starts with a solid 100 days of potential sales. But, alas, not all of these will be sunny. There’s a sneaky factor called Days Lost, which includes everything from freak thunderstorms to his beloved van breaking down.

Here’s how the numbers shake out:

On average, Mr. Whimsy loses about 6 days over the summer. Not bad, right? But in those rare, unlucky summers, he could lose as many as 30 days—that’s nearly a third of his season gone!

Why might he lose these days? Well, the risks are real, and they’re not just about the weather. Here’s what’s causing the trouble:

Weather Woes: In the ice-cream business, weather is a given. Come rain or shine, you’ve got to roll with it. In the past, bad weather has cost Mr. Whimsy up to 7 days of sales over the course of a summer, but he’s a hardy fellow so usually he only misses 2 days when the rain gets really bad.

Equipment Failures: What’s worse than a rainy day? The day the freezer gives up the ghost! Mr. Whimsy knows equipment doesn’t last forever but a frozen freezer or defective dispenser could steal away up to 14 days of business if it packs in mid-summer.

Van Mishaps: Sometimes, the biggest threat isn’t even the weather—it’s the van. Whether it’s stolen or damaged (and yes, ice cream vans are hot property!), Mr. Whimsy could lose up to 21 days waiting for repairs or a replacement.

Wimbledon Washout! Weather woes are one thing, weather-related wildcards from climate change are another. Mr. Whimsy predicts that every five years or so, the end of summer could be hit with storm-force winds and rain lasting over a week! During such times, he’ll be stuck at home, and that could wipe out 14 days of sales in one go.

Now, not all of these events are going to happen together and this is where Mr. Whimsy turns to the power of scenario analysis. By running his trusty simulations, he can see how the various probabilities combine and he can be pretty confident that even in the most challenging of seasons, he would only lose around 14 days.

Scoops, Sales, and Sweet Success (Maybe?)

When Mr. Whimsy does get to sell, sales days can be a rollercoaster ride! Mr. Whimsy doesn’t always get prime real estate. Each week he’s assigned a location. It could be a bustling tourist trap or a dead-end tourist not-spot. If it’s the latter, with minimal foot traffic, he might struggle to sell even half of what he expected. The simulation predicts that while on the busiest days he could scoop out up to 120 cones​, on average he’ll serve around 88 ice creams per day. That’s down on his initial estimate but still a lot of smiles in a cone.

There’s also the issue of competition that will impact his prices. If he’s the only vendor in the area, he might be able to set his prices higher and still sell plenty of ice cream. But if there are more vendors nearby, he might lower his prices to stay competitive, which could cut into his revenues. Still, most days Mr. Whimsy should see steady sales, and when you multiply that by his expected average price of £2.78 per cone, things look pretty tasty.

The Grand Total: What’s in Store for Mr. Whimsy?

So, what does all this mean for Mr. Whimsy’s bank balance at the end of the summer? Across all these ups and downs, he can expect his total sales to be around £23,200, down on his intial estimate but there is the possibility (albeit likely only once-a-decade) of hitting £32,700 or more​. Now that would be a pretty sweet summer!

But let’s not sugarcoat it—if things go awry, Mr. Whimsy could be facing a tough season, with sales dropping as low as £14,300 in a severe but plausible scenario. The van’s been stolen, the rain won’t quit, and the freezer’s on strike—no ice cream empire was built without some sour days!

What’s the Lesson for All of Us?

Running a business, whether it’s ice cream or the latest whizz-bang fintech unicorn, means preparing for the unexpected. Mr. Whimsy knows that not every summer will be sunshine and high sales, but thanks to scenario analysis, he’s prepared. And that’s the real takeaway here: by planning for all the “what ifs” using smart tools like simulations, businesses can make sure they’re ready for whatever comes their way. So to prempt those occassional bad times, Mr Whimsy could build up his financial reserves, and he could look at additional insurance cover for the van and equipment. Or he could go further by changing strategy, perhaps by ditching his location agent and bagging himself a fabulous summer of festival fun instead, with bumper profits to boot! And since he knows how to run scenario analysis, he can update and re-run his model to see how these adjustments could impact his expected revenues.

The impact of price and season duration changes on expected total sales

CDF plot

What Does This Mean in Practice?

Mr. Whimsy’s ability to plan ahead gives him a clear advantage—he knows when to play it safe and when to push forward. Here’s how you can apply the same thinking:

Investing in New Equipment: Whether you’re thinking of upgrading your machinery, tech systems, or expanding your workforce, simulations can help you understand whether expected revenue can support the costs. What if revenues fall by 10% due to unforeseen market shifts? Do you still break even, or would that leave you in the red?

Launching a New Product: Thinking about rolling out a new product or service? Monte Carlo simulations can help you anticipate the best- and worst-case scenarios. If demand isn’t as high as you hoped, would you still see a return on your investment, or would that new venture become a drain on resources?

Handling Unexpected Downtime: Just like Mr. Whimsy’s equipment failures, your business might face unexpected breakdowns or system outages. Simulations can help you quantify how much downtime you can handle before it seriously impacts your operations. Do you have contingency plans in place to minimize disruptions, or would an unexpected failure catch you off guard?

Cybersecurity Threats: In today’s world, a data breach or cyberattack could grind your operations to a halt. Simulations can assess the potential impact of a cyber event—how long would it take to recover, how much would it cost, and what customer trust would you lose? Are your current defenses strong enough, or is your business more vulnerable than you think?

In all these scenarios, having a clear view of the possible outcomes—both good and bad—helps you make smarter, more informed decisions. Just like Mr. Whimsy, you’ll be ready to weather the storms, dodge the breakdowns, and come out stronger, no matter what.

So, whether you’re selling ice cream, launching a tech startup or working at a bank, get to know your risks and plan for them. Because – to paraphrase Don Kardong – in business, as in life, without ice cream or risk insights, there would be darkness and chaos.

Strengthening Risk Management in Trading

Mitigating Rogue Trading with Governance, Controls, and Reporting Systems

In the corridors of high finance, certain traders stand out not just for their skills. These individuals often occupy pivotal positions within their firms, granting them access to sensitive information and significant trading power. Under pressure to deliver consistent profits, their actions are rarely overt; instead, they weave a web of small deceitful decisions that go unnoticed until the damage is irreparable.

The environment in which these traders work is typically one of intense pressure and high expectations, where success is measured by short-term gains and personal reward. Employers, driven by the demand for impressive performance, may inadvertently create fertile ground for reckless behavior by prioritising results over strict compliance. Ultimately, it is a combination of personal ambition, a permissive corporate culture, and the ability to operate undetected for a period of time that makes these traders uniquely risky assets for their employers.

In the world of financial trading, rogue trading remains a significant operational risk, often leading to catastrophic losses when left unchecked. As financial institutions continue to grow in complexity and trading environments evolve, mitigating these risks requires robust governance, enhanced internal controls, and effective reporting systems. In this follow-up article, we explore the practical steps that organizations can implement to reduce the likelihood of rogue trading and mitigate its impact, based on established regulatory guidelines and operational risk management frameworks.

The Root Causes of Rogue Trading

Rogue trading often arises when unauthorized trades bypass internal controls, leverage is misused, or trading operations are poorly monitored. The infamous case at Société Générale in 2008, where a rogue trader caused billions in losses, highlighted the potential for disaster when governance mechanisms and risk controls fail. Key factors contributing to rogue trading incidents include:

Lack of oversight and governance at senior levels

Inadequate separation of duties between the front, middle, and back offices

Weak internal control mechanisms

Ineffective reporting and early-warning systems

To mitigate these risks, financial institutions must adopt a comprehensive approach that integrates robust governance structures, stringent control measures, and real-time reporting mechanisms.

Key Mitigation Strategies

While Monte Carlo simulation provides valuable insights, it functions as one component of a comprehensive control framework:

Primary Controls Secondary Controls
  • Real-time position monitoring and reconciliation
  • Four-eyes approval processes for trades
  • Independent price verification
  • Automated limit checks
  • Scenario analysis and stress testing
  • Monte Carlo simulation for exposure assessment
  • Independent risk appetite monitoring and control assurance
  • Robust risk and audit oversight

The simulation results should inform the calibration of these controls. For example, if simulations show potential for rapid loss escalation under certain conditions, institutions might:

Control Description
Independent risk oversight Establish an independent risk management function to provide oversight and challenge on risk-taking activities.
Lower position limits Reduce the maximum positions that traders can hold to limit the potential for outsized losses.
Increase margin requirements Require traders to post higher levels of margin to cover their positions, reducing the leverage in the system.
Enhance monitoring frequency Increase the frequency of position monitoring and reconciliation to identify potential issues more quickly.
Implement additional approval layers for specific product types Introduce additional layers of approval and oversight for complex or higher-risk products.

1. Strengthening Governance Mechanisms

At the heart of effective risk management lies strong governance. Senior management must have a full understanding of both the potential and actual operational risks posed by market-related activities, particularly within trading desks. Governance measures should ensure:

Clear segregation of duties between the front office (trading), middle office (risk management), and back office (settlements and accounting). This separation helps prevent unauthorized actions by ensuring that no one individual has control over the full trade lifecycle.

Committees with risk oversight roles should be established. These committees must have adequate resources to challenge front-office activities and ensure that any suspicious trading behavior is addressed immediately.

Promotion of a risk-aware culture within the trading environment is also critical. Traders should operate under clear terms of reference, with frequent reviews and escalation procedures in place to investigate breaches of trading limits.

Governance frameworks that promote transparency, accountability, and high professional standards in trading environments provide a critical first line of defense against rogue activities.

2. Enhancing Internal Controls

Robust internal controls are essential for detecting and preventing unauthorized trading activities. Institutions should implement the following controls across all trading desks:

Rigorous trade confirmation, reconciliation, and settlement processes: All trades should be immediately reported and confirmed by the middle or back office, ensuring that any discrepancies are identified early. Confirmation processes should occur independently of the front office to reduce the risk of manipulation.

Mandatory “desk holidays” for traders: Requiring traders to take at least two consecutive weeks away from their desk annually allows a fresh set of eyes to review their books, making it harder for fraudulent behavior to go undetected.

Real-time monitoring of leverage and credit limits: Since rogue trading often involves excessive leverage, institutions should implement real-time systems to track positions and prevent breaches of set limits. Large trades or deviations from normal trading patterns should trigger automatic alerts for immediate investigation.

Additionally, audit trails documenting every step of a transaction—from initiation to settlement—enable institutions to maintain transparency and accountability, ensuring that even minor errors are traceable and correctable.

3. Improving Reporting and Early-Warning Systems

Early detection of rogue trading relies heavily on effective reporting systems. Institutions must establish internal reporting structures that can identify and escalate material incidents quickly:

Comprehensive risk reporting systems should generate real-time alerts when trading patterns deviate from expected norms. Whistle-blowing mechanisms should also be in place to allow staff to report suspicious behavior without fear of retribution.

Daily profit and loss (P&L) and position reconciliations: These reconciliations are critical for spotting unusual spikes or anomalies in trading activities, which may indicate rogue behavior. Random checks on trades, combined with analysis of key risk indicators, allow for rapid intervention before losses accumulate.

Regular fraud testing and scenario analysis: Institutions should periodically test their systems for vulnerabilities to fraud and rogue trading. By conducting scenario analyses, organizations can better understand where and how fraudulent behavior might emerge, enabling them to adjust their controls accordingly.

Moreover, reports should be well-structured, clear, and escalate issues in real-time to relevant control functions and senior management, ensuring that corrective action is taken swiftly.

Fraud Prevention and Detection: A Critical Element

Given the complexity of modern financial markets, the potential for both internal and external fraud has risen sharply. Institutions must actively integrate fraud detection into their operational risk frameworks. This can be achieved by:

Developing a fraud risk mapping program: By mapping potential fraud risks within trading activities, institutions can better prepare their systems to detect anomalies.

Increased fraud awareness training for all staff involved in trading and settlements. This ensures that individuals at every level understand their role in preventing and reporting fraudulent activity.

Rigorous testing and monitoring of fraud prevention systems, ensuring that they can handle the scale and complexity of modern trading environments.

Conclusion: Building Resilience Against Rogue Trading

Mitigating the risks associated with rogue trading requires more than just compliance with basic regulations—it demands a proactive, integrated approach that encompasses governance, controls, and reporting systems. Monte Carlo simulations can help quantify potential exposures, but real-time governance and control mechanisms are essential for preventing these exposures from materializing into actual losses.

Financial institutions must prioritize the development of a risk-aware culture, enforce clear segregation of duties, and leverage advanced technology to detect and respond to anomalies in trading activities. By doing so, they can reduce the likelihood of rogue trading incidents and limit their impact if they do occur.

In an industry where operational risks are ever-evolving, institutions that strengthen their internal frameworks are better positioned to protect both their reputations and their bottom lines.

For further insights: Guidelines on management of operational risk in trading areas (europa.eu)

Rogue Trading Scenario Assessment

How Monte Carlo Simulation Guides Decision-Making

Operational risk in financial institutions can emerge from unexpected corners, with one of the most severe examples being rogue trading. A single unauthorized trade can spiral into catastrophic losses, especially when factors like market volatility and leverage come into play. In this context, Monte Carlo simulation proves to be an invaluable tool, offering insights into potential risks, helping institutions prepare for worst-case scenarios, and making informed decisions to mitigate these risks.

In this article, we explore how Monte Carlo simulation can help financial institutions quantify and manage the risks associated with rogue trading, using a real-world scenario focused on unauthorized bond trading at a mid-sized UK bank.

The Rogue Trading Scenario: Complex Risks with Severe Consequences

In this scenario, a rogue trader on a fixed-income desk engages in unauthorized bond trading, taking highly leveraged positions. The situation worsens when adverse interest rate movements, credit downgrades, and forced liquidation lead to escalating losses. This underscores the critical role of risk oversight and the devastating impact of hidden exposures.

But how can institutions foresee such complex risk dynamics? This is where Monte Carlo simulations become crucial. By modeling a wide range of possible outcomes—factoring in trade frequency, undetected periods, interest rate shocks, and market responses—Monte Carlo allows risk managers to quantify potential losses and develop strategies to address them.

How Monte Carlo Simulation Supports Decision-Making

Capturing the Full Spectrum of Risk

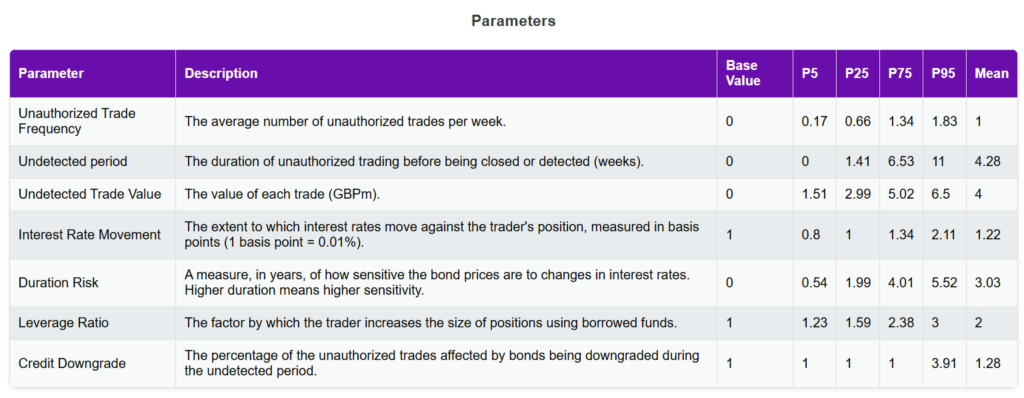
In rogue trading scenarios, many factors influence potential losses, from how long unauthorized trades remain undetected to the size of interest rate shocks and credit downgrades. Monte Carlo simulation captures the variability across these dimensions, generating thousands of possible outcomes based on different combinations of these variables. This gives decision-makers a clearer picture of not just the likely outcomes but also the extreme cases that could lead to severe financial exposure.

For instance, the simulation models key parameters such as:

  • The frequency of unauthorized trades.
  • The undetected trading period.
  • Interest rate shifts and their impact on bond prices.
  • Leverage ratios, which amplify both gains and losses.
  • The possibility of credit downgrades affecting bond positions.

By integrating these variables, the simulation provides a holistic view of the potential exposure, from common scenarios to rare, catastrophic losses.

Quantifying Rare but High-Impact Events

One of the greatest benefits of Monte Carlo simulation is its ability to help businesses prepare for extreme but rare events. In the rogue trading scenario, adverse events such as interest rate shocks and credit downgrades have low probabilities but can lead to substantial losses when they do occur. The simulation quantifies these tail risks, giving risk managers data on how severe the impact could be in a 1-in-20 or 1-in-200 scenario.

For example, if interest rates shift by an unexpected margin, the simulation shows the effect on unauthorized leveraged bond positions. The outcomes from this simulation provide answers to critical questions: How much could we lose in a worst-case interest rate shift? What happens if a significant portion of unauthorized trades are downgraded in credit quality?

By offering probabilities attached to these extreme scenarios, Monte Carlo simulation gives institutions the foresight to prepare for the unexpected.

Understanding the Impact of Leverage

In financial markets, leverage is a double-edged sword—it magnifies gains but also amplifies losses. In this scenario, the rogue trader’s use of leverage multiplies the potential damage from unauthorized trades. The Monte Carlo simulation helps quantify just how much leverage could increase exposure to loss. It models different leverage ratios and shows how each increment could escalate financial risk, particularly in combination with market events like interest rate shifts or credit downgrades.

Through the simulation, institutions can see the compounded effects of leverage, making it easier to set limits or design policies to restrict unauthorized leverage usage. This is crucial because excessive leverage often turns what might have been a manageable loss into a disaster.

Measuring Combined Risk Exposures

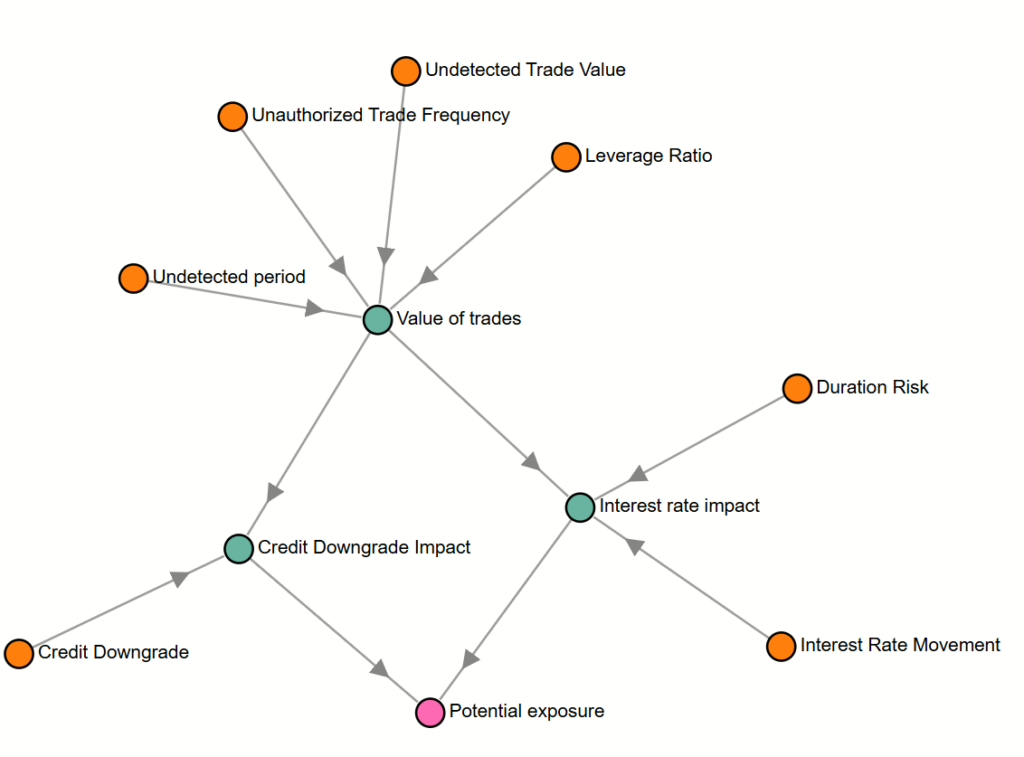
Rogue trading risk doesn’t stem from a single factor—it’s a combination of market events (such as interest rate movements and yield curve shifts) and internal missteps (like undetected trades and excessive leverage). Monte Carlo simulation enables institutions to measure combined exposures by calculating how these various factors interact.

For instance, in this rogue trader scenario, the simulation evaluates:

  • The effect of leveraged unauthorized trades on exposure.
  • The impact of interest rate changes on those leveraged positions.
  • Additional risks from yield curve shifts and credit downgrades.

The simulation also accounts for convexity adjustments—an additional cost incurred when unwinding bond positions in illiquid markets. All of these combined exposures can lead to total losses that are much larger than initially expected. By modeling these interactions, the Monte Carlo simulation reveals the potential for severe losses beyond what simple risk metrics might suggest.

Preparing for Regulatory and Market-Based Metrics

Finally, Monte Carlo simulations can inform regulatory stress testing by showing if an institution’s total exposure breaches critical thresholds under extreme conditions. For example, in this scenario, the simulation tracks whether exposure exceeds £12 million in a 1-in-20 event or £30 million in a 1-in-200 event—key metrics that would trigger regulatory or market-based concerns. This insight helps financial institutions comply with stress testing requirements while also giving them the opportunity to adjust their risk management strategies proactively.

Conclusion: Monte Carlo Simulation as a Strategic Risk Management Tool

In scenarios like rogue trading, where the interplay of unauthorized activity, market volatility, and leverage creates a web of risk, Monte Carlo simulation provides a clear framework for navigating uncertainty. By generating a range of possible outcomes, this tool helps financial institutions quantify both common and extreme risks, supporting data-driven decision-making that mitigates potential losses.

As financial markets become more complex and interconnected, the importance of understanding and managing operational risks cannot be overstated. Whether facing rogue traders or market shocks, Monte Carlo simulations offer a critical lens through which institutions can prepare for the worst while optimizing their strategies for the best outcomes.

Incorporating such simulations into your operational risk management approach today could be the key to avoiding tomorrow’s financial disaster.

Open to Work!
Curious about how scenario analysis can help your business? Share your email and let's have a chat.